Some people continue to argue that renters are smarter than homeowners, because renters didn’t get caught up in the ‘06-’08 buying frenzy. The credit reports of the few people unable to borrow during the heyday of the easy credit market…what might those look like?
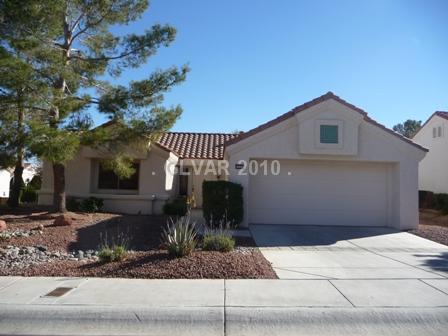
In March 2003 we purchased a 3-bedroom, 2-bath, 2-car-garage single-story single-family home in a “good enough” location. The house was built in 1999, is 1238 square feet and sits half a mile from Summerlin, the nation’s #1 master-planned community.
Price: $149,900 ($152,599.60 including closing costs)
1st mortgage $147,584 (Federal Housing Administration)
$ 885 Principal & Interest (6%)
$ 62 Mortgage insurance premium
$ 110 Taxes
$ 40 Insurance
$1097 Total
Repairs & maintenance (2003-2005) = 0
Total cost until April 2005 = $28,522 (26 months x $1097)
We refinanced in April 2005 to reduce the interest rate & remove the MIP.
1st mortgage $160,000 (Conventional)
Monthly payments:
$ 946 Principal & Interest (5 7/8%)
$ 152 Taxes
$ 36 Insurance
$1134 Total
Repairs & maintenance (2005-2009) =$2000
Total costs up to today $58,032= (48 months x $1134 + $2000 repairs & maintenance + $1600 in loan fees)
Total ownership costs $86,554
Tax write-off
Interest Taxes
2003 $ 6,344 $ 1,139
2004 8,459 1,395
2005 11,927 1,652
2006 9,276 1,701
2007 9,151 1,752
2008 9,018 1,805
(You have to itemize your deductions to write off mortgage interest and real estate taxes. Your writeoffs might phase out, depending on your income.)
Over the 6 years we’ve owned the property, we wrote off $63,619 in expenses against other income, reducing our costs to $22,935.
Our principal balance is $150,790.
The property is worth $170,000 (comparable houses range from $160,000-180,000)
Equity is thus $19,210, meaning the cost to own this house has been $3,725, or $51 per month.
If we’d rented a comparable house for the last 6 years, the cost would be $75,825, or $1,053 per month. Invested at 5%, that’s $83,931.79. Enough to buy another house.


