A fundamentally sound, good old-fashioned chest past of a post

Is it Recycle Friday already? Pretty soon we’re going to have to start creating new Friday content. In the meantime, this post that originally appeared on My Journey to Millions will have to tie you over. Tide you over? One or the other. Maybe later on we can home in on the right word. Or hone in on it.

Either way, today’s post explains why companies like E*Trade and their heat zone mapping or whatever the hell they call it for selecting stocks are doing more harm than good.

"Walton, why do you always smell like my grandson's bedroom?"

There are two major ways to evaluate stocks: fundamental analysis and technical analysis.

Groan. Stop whining. This isn’t difficult.

Fundamental analysis means assessing a company’s financial statements: taking the accountants’ work and reaching conclusions with it.

Technical analysis is the financial equivalent of astrology. It involves looking at how a company’s stock is performing – not how the company itself is performing – and using that to figure out what the stock will do.

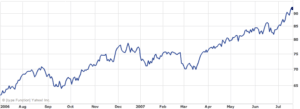
Here’s an example of why that’s insane. This is what ExxonMobil stock did from July 3, 2006 to July 20, 2007:

Exxon Chart 300x109 What Can John Wooden Teach us about Stock Analysis?

If you remember, public sentiment at the time ran something like:

The oil companies are bleeding us dry!
They’re fixing prices!
They’re in cahoots with the Bush Administration, the Elders of Zion, the Illuminati and the Trilateral Commission!

What could possibly be a better investment for the short term than a monopolistic, chronic polluter with powerful connections and a product we can’t live without? Any room for me on that gravy train?

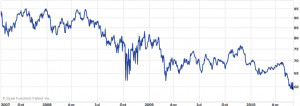
Here’s what ExxonMobil has done since then:
Exxon Chart 2 300x106 What Can John Wooden Teach us about Stock Analysis?
The scale on the y-axis changed, but not by much. What happened?

Centrifugal force happened. Public perception brought the stock up to a level it couldn’t sustain. Then reality set in and the stock got too expensive to attract new investors. In July of 2007, a technical analyst would have measured the angle of ExxonMobil’s rise and expected it to continue its northward progress. That same technical analyst wouldn’t reply to your emails today, assuming you could find him.

Most people who offer stock tips advocate some form of technical analysis. Why? Because it’s easy.  It takes .12 seconds to comprehend a chart.

You’ve heard the disclosure phrase “past performance is not necessarily indicative of future results.” Aside from the inelegant use of the passive voice, the statement makes a lot of sense. When a stock picker uses it to keep things all nice and legal, you have to make a couple of logical connections to deduce the message, which is:

That technical “analysis” we sell? This statement renders it invalid.

Everything is cyclical to some extent, right? No stock consistently outperforms the market, because the numbers don’t allow for it. There’s a ceiling, and it’s lower than you think. If the stock of a company with a market capitalization of $20 million were to double every year, within less than a generation it’d outpace the nation’s gross domestic product.

Fundamental analysis means perusing the unglamorous, dry columns of numbers that accompany corporations’ annual reports. It means going through a few years of data and comparing last year’s net revenue numbers to the previous year’s. Determining whether a company’s net profits increased, or if there’s a good reason why they decreased.

“Picking” a stock in the conventional sense – i.e., figuring out which one is going to suddenly jump in value – is a bigger scam than keno. The established stocks – the Dow components, the companies with the largest revenue and profit numbers – are traditionally the stocks with the strongest likelihood of maintaining their value.  But because they’re so big, it’s impossible for them to grow that much more. Any company on this list will probably halve in size before it doubles. For a sports analogy (ladies, I’ll make this as easy as possible), Gordon Beckham (.203) is far more likely to raise his batting average by 50 points than Ichiro Suzuki (.358) is. Market conditions prevent the frontrunners from gaining any significant value. It’s the laggards who make the biggest gains.

And suffer the biggest losses.

Continuing with the analogy, Ichiro’s batting average can afford to move 50 points in the other direction. But if Beckham’s does, he’ll be on either the bench or a bus to Charlotte in short order.

This is another place where we see how badly humanity assesses risk.  It’s easy to look at the potential for profit, less so to even acknowledge the possibility of loss. From Gilbert & Sullivan’s Utopia, Limited, the librettist suggests that if you’re going to create a company, begin with a trivial market capitalization. Say, 18p:

You can’t embark on trading too tremendous.
It’s strictly fair, and based on common sense.
If you succeed, your profits are stupendous,
And if you fail, pop goes your 18 pence.

A sports analogy, followed by a theater analogy. There, now everything’s in balance.

What’s more likely to hit zero – a company that’s already made its way to consistency, or one that’s closer to being 18 pence away from “popping”?

Of course there’s value in the occasional startup company. If you can find them with any consistency, then please, write this blog for us. You can even rename it after yourself.

And remember: the next coach who tells his team “you need to work on your technicals” will be the first.

Your mutual fund is battling back

Do a Google image search for "rich woman", and for some reason this picture of Malcolm Gladwell comes up

Welcome to Recycle Friday, in which we dig up the carcass of a vintage guest post of ours and see how it stands up in the modern era. Today’s originally ran on 20sMoney last year. Annotations in CYC maroon:

Today’s happy headline (“Your mutual fund is hurting worse than you think”) necessitates a little look back. How does today’s Dow Jones Industrial Average compare to, say, the Dow of February 1997?

Answer: It doesn’t. Sure, the average is 10,192 today (12,069 this morning, baby! The proverbial gravy train with biscuit wheels! Start borrowing!) and was around 6900 twelve years and 3 months ago, but…the average of what?

The Dow is the sum of the prices of 30 of America’s largest stocks, multiplied by a constant. But the roster of stocks itself isn’t constant. Here are some of the blue chips that comprised the Dow in ‘97:

General Motors
Citigroup
AIG

(This is already reading like a list of notorious contemporary eradications. Despite where we appear to be heading, the next items on the list are not the Seattle SuperSonics, the French franc and Lindsay Lohan’s career.) (Those semi-pop culture references still hold up, kind of. Maybe we could trade out Charlie Sheen for Lindsay Lohan, but that’s it.)

Altria
Honeywell
Eastman Kodak
International Paper
AlliedSignal
3M
Goodyear
Sears Roebuck
Union Carbide
Bethlehem Steel
Westinghouse
Woolworth

That’s almost half the then-Dow, consisting of the infamous and the doddering. Today, these names sound as though they belong in some bygone epoch of American proto-commerce. (Woolworth, if you’re interested, took scarcely more than a generation to fall from five-and-dimes with lunch counters that wouldn’t serve black people to sneaker retail. The company shed all its fat and kept its one legitimate asset, which is now its successor company – Foot Locker.)

So yes, the Dow has “risen” 60% since the cloning of Dolly the sheep. But that’s comparing today’s Dow to something that no longer exists. A basket of 1997 Dow stocks wouldn’t have risen anywhere near 60%:  a lot would depend on whether you used your General Motors certificate to make a paper airplane out of or wipe up kitchen spills with.

(Since then, General Motors made a comeback of sorts. The old shares were indeed rendered worthless, thanks to a federal government that decided that GM’s bondholders and owners didn’t matter as much as its employees – or more importantly, its employees’ union bosses. The new shares began selling on November 18 at $34.19. Fortuitously, they just happened to have dropped a record 5% yesterday to close at $33.02. Did we mention that your tax dollars are responsible for this? We did.)

(No Dow stocks have changed out since Cisco and Travelers joined in 2009. In fact, none of the current 30 are even in trouble.)

Conversely, if you’d had the foresight to invest in stocks that were to become Dow components –Verizon, AT&T, Chevron, Cisco, Intel, Pfizer et al. – you’d have enjoyed a lot more than a 60% return over 12 years. But you’d have had to predict that cell phones would become ubiquitous, gas prices would rise, every new electronic component would need a router, and every man in America would convince himself that little blue pills were the only things standing between him and a happily exhausted wife.

What about companies that barely existed in 1997? Google didn’t trade publicly then, and wouldn’t for years. Yahoo! did, at around $1. Each company’s profound growth remains invisible to the Dow.

Because the Dow regularly replaces its weaker components with stronger ones, its levels can mislead. Only if you own a Dow index fund – a basket of stocks that consists of equal proportions of Dow components, and whose makeup changes as the Dow itself changes – can you truly track that investment consistently over the years.

But because the Dow is measured in dollars, or at least a mathematical manipulation thereof, you have to account for inflation. The Consumer Price Index has risen 37% since February of 1997. (And 1.4% annually since this post first ran. Are we ever going to see the hyperinflation we’ve been anticipating?) (The Consumer Price Index is subject to biases of its own, but explaining them would require a few thousand more words.) The Dow itself has risen 43% in that same period. (See above.) So in real dollars, a Dow index fund has appreciated .4% annually since then. Two-fifths of a stinking percent, and that’s ignoring broker fees. Should the Dow drop another 400 points – and it dropped half that much in the last 10 minutes of trading on May 23 – that’d wipe out every penny of those miniscule gains. That’s one term of Clinton, two terms of Bush, and a term-in-progress of Obama with no appreciable gain in the Dow.

(The changes since then amount to a rounding error. Seriously, it’s up to an annual increase of 1.8%. Maybe things really are looking up, if by “things” we mean “stocks” and by “up” we mean “harder to buy”.)

Your conservative neighbor whose entire portfolio is 3-year CDs doesn’t look so stupid now, does he? Yes, it’s easy to look back with perfect eyesight, but there is such a thing as overdiversification. And while that’s never as dangerous as riding the waves with only one or two stocks, it does lower your ceiling. When you put your eggs in one gigantic uber-basket, you’re not giving undervalued, bargain stocks a fair chance to boost your portfolio.

At Control Your Cash we shudder at the idea of frequent and indiscriminate turnover. A stock is an investment, not a blackjack hand. But we also hammer one primary mantra: Buy assets, sell liabilities. Do that often enough and you can’t help but get rich. Overpriced Dow components (and other big companies) with poor fundamentals are almost always liabilities.

(Fortunately, Dow Jones Inc., the folks who determine which stocks comprise its bellwether index, have gotten a little more pragmatic lately. A company’s history, or its influence of a couple generations ago, is no longer as important as what it’s done for us lately. Maybe those fancy semiconductors and software really are here to stay.)

**This post is featured at the Totally Money Carnival #9-Funny Baby Videos Edition**

Nothing says “I love you” like the actual words

Come on in! We're having a special on 2002 Valentine's Day gifts!

So say it. By talking, not by impoverishing yourself.

It’s tough to determine whether Mothers Day or Valentine’s Day is the biggest crock of garbage on the retail liturgical calendar. After a few seconds of weighing this, we’ll go with Mothers Day. At least Valentine’s Day has been celebrated for centuries*.

This isn’t an anti-capitalistic jeremiad. Spend all the money you want, but at least spend it on something of value. Look, we’re not sociologists. Nor are we in that camp of reactionaries who think that consumerism and its sidekick, advertising, are the work of the devil. But come on. If you’ve seen the messages and feel even a hint of obligation toward spending money on something with minimal inherent value, we can come over there and slap you if that’s what it takes. There are plenty of Western customs you can honor (shaking hands, exhibiting good table manners, failing to torture cats) without throwing money away.

Just look at the slogans:

Helzberg Diamonds: “I am loved.”

Ergo, any woman who isn’t in a relationship with a Helzberg customer is being taken for granted and/or treated like garbage.

It’s the same as that “2 months’ salary” rule of thumb that jewelers came up with sometime in the mid-20th century and somehow got a grossly gullible public to swallow. Think about that for a second – an industry suggests that you should spend 1/6 of your annual income on its product, and people take it to heart.

Imagine if an industry that produces something far more useful – like groceries, or better yet, health insurance – tried to get away with that reasoning.

Seriously. Mental exercise time. What if an HMO used a similar tactic?

Hi. We’re your friends at CIGNA. Do you have enough protection against unforeseen accidents and illnesses? You never know when disaster might strike you or your loved ones, and possibly turn into tragedy. That’s why we recommend that you spend at least 10% of your pre-tax income on coverage. It’s a small price to pay to minimize the childhood leukemia deaths in your family.

The only question is which senator would chair the 2011 hearings on Unconscionable Advertising Messages Foisted By A Mercenary Industry On The Public. Our money’s on Chuck Schumer.

If you want to listen to a jeweler’s message, Zales’ slogan from the 1940s is particularly forthright, especially if you contemporize it for inflation – “A penny down and a dollar a week.”

The practice of buying jewelry, especially at this time of year, is the loudest and most imbecilic real-world rebuttal of Control Your Cash Mantra #1 – bolded, italicized and underlined here for your pleasure: Buy assets, sell liabilities.

Finance something if there’s a legitimate economic reason for it – the example we give repeatedly is homebuying. If you want a house, better to finance it than to pay rent for years and years when you could have been enjoying a home on credit. Even if your circumstances lead you to disagree with that sentiment – you live in an area with a chronically poor housing market, or your data indicates that it’ll become one before you plan to move out of any house you might buy – you have to agree that at least a house has utility. Financing a car is harder to justify than financing a house, but again, utility: we still haven’t developed a more efficient way to get from point A to point B at your leisure (assuming points A and B are on land) than by driving.

Where’s the utility in a non-industrial diamond? You’re not going to use it as a drill bit. No, it’s a totem of some emotion that you can only truly convey with actions, not expensive objects.

We’d include a chart showing how much what you spent on that tennis bracelet could grow to over the next x years, but you’ve seen similar charts before and the inevitable conclusion is so obvious that it doesn’t require mathematical reinforcement.

If you don’t care about your future together, act like you mean it: by dropping money on – or better yet, financing – a shiny trinket.

And ladies, if you need a bauble to validate your relationship, or your man, you’re one step above your colleagues whose husbands smoke cigars. (Why not just wear a button that says, “With all the tasty parts of me available to put in his mouth, he instead chooses the foulest-smelling thing this side of the public toilets in Calcutta. No, no hypermasculine phallic symbolism to see here”?)

Look, moments don’t sparkle. And if they do, it’s only a figure of speech. A Vermont Teddy Bear might not be imaginative, but it’s fun to hold. More importantly, the recipient isn’t going to wear it in public – making it a private token of a relationship that you shouldn’t be sharing with the rest of us anyway. And, the one we researched on their website costs only $80.

*If you care about this kind of arcana, the idea that the Hallmark Corporation created Mothers Day is an urban legend. Mothers Day is the brainchild of Anna Jarvis, a 19th century woman who wanted to honor her own mother. Jarvis mère spent the Civil War attending to wounded soldiers, both Blue and Gray. Jarvis fille, as women often do, kept pestering the authorities to make the holiday official. She died poor and childless.

**This post is featured in the Carnival of Wealth #27**