Karl Case and Bob Shiller aren’t much to look at, so here’s a picture of a couple of gorgeous chicks instead.
Let’s answer the 2nd question 1st. (That’s for you, series of English teachers who said that ordinal numbers must be spelled out. Go to hell.)
Yes.
As for the 1st question, it’s a way of comparing prices over time, specifically home prices.
But anyone can create a price index, right? Don’t you just need some raw data and a calculator? Houses in this city cost this much in the baseline year, they cost this much today. Divide the latter by the former, divide that by the rate of inflation and Bob’s your uncle.
Yeah, but there’s more to it than that.
The Case-Shiller index began by comparing repeat sales of the same homes. They also threw out the sales that weren’t “arm’s length” – e.g., parents selling houses to their kids or their limited liability companies. Those excluded transactions would distort the numbers, for obvious reasons.
There are plenty of official indices that track home price movements, most of which are deficient somewhere. For instance, the federal government publishes a home price index. But it’s the branch of the federal government that oversees taxpayer charity cases Fannie Mae and Freddie Mac, which means that the index only accounts for homes with Fannie- and Freddie-approved mortgages, which means that the index excludes all-cash transactions and jumbo mortgage transactions. There’s another index, developed by a private company, that goes out of its way not to restrict itself to repeat sales like Case-Shiller does, the argument being that that limits the number of transactions required to compile the index.
If this sounds deathly boring, of course it is. Even our famed CYC style can’t suscitate a topic as dry as this. What’s so special about the Case-Shiller index, and what’s made it the definitive index for measuring changes in home prices, is that it gives additional weight to repeat sales. That’s supposed to make Case-Shiller a more accurate reflection of the market, in that a house that sells twice should presumably have twice as much impact on the numbers as a house that sells only once (in the given period.)
So does the Case-Shiller index have a purpose beyond giving the news anchors at Fox Business Network a chance to quote it and sound authoritative? Absolutely it does. Because in the same country where 48 states prohibit gambling on sports, and where the Securities and Exchange Commission valiantly defends private citizens from the scourge of markets for future events, yet collateralized debt obligations are not only perfectly legal but backed with the full faith and credit of the United States government (if you happen to be on the right side)…you can wager on the Case-Shiller index!
Yes, the Chicago Mercantile Exchange lets you buy futures contracts and options – which is to say, place bets – on what the index will do. The Exchange calls it “risk transfer”, which is no different than what you do when you buy insurance at the blackjack table. (Assuming you’re playing blackjack. Don’t play blackjack.) If you think the index will rise, and with it home prices, buy a put option at a certain price. If you think the index will fall, buy a call option. If you don’t know what put and call options are, or anything else about the stock market, buy our book.
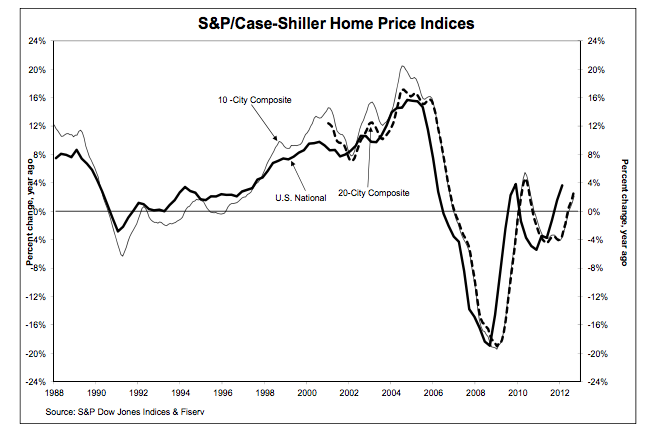
You’ll notice that with one brief hiccup, 2 if you count the current one, home prices have been falling since 2006. Case-Shiller keeps multiple indices, clearly illustrated on the chart. Also clear is that they move in harmony, more or less.
The Case-Shiller Index isn’t usually quoted as an absolute number, as the Dow Jones Industrial Average or the S&P 500 is. Rather, the Case-Shiller Index is quoted as a difference over a prior period, e.g. “The CSI rose 3.4% year-over-year”.
In fact, the national Case-Shiller index rose 3.6% over the index from a year ago. Good news! The housing market is recovering, errr…homes are getting harder to buy. Isn’t that fantastic?
Like every other financial statistic, how “good” or “bad” it is depends on what side of the transaction you’re on. AND…even if you’re a fan of rising home prices, the current 3.6% increase doesn’t account for inflation, which was last measured at 2.16% year-over-year. So home prices have risen about 1.44% in the last year, if you had to throw a single number on it and ratiocinate it to 2 decimal points.
There isn’t a staggering difference between one comprehensive home price index and the next. Nor is there much variation in the information these indices convey. Nor should you pay much heed to news stories that say the housing market is “recovering”. It’s still a fantastic time to buy a house as opposed to renting, seeing as prices and mortgage rates remain at long-term lows. It just maybe isn’t as good a time to buy as it was a year ago. (A year and 2 months ago actually, factoring in Case-Shiller’s lag time.)


