A fundamentally sound, good old-fashioned chest past of a post

Is it Recycle Friday already? Pretty soon we’re going to have to start creating new Friday content. In the meantime, this post that originally appeared on My Journey to Millions will have to tie you over. Tide you over? One or the other. Maybe later on we can home in on the right word. Or hone in on it.

Either way, today’s post explains why companies like E*Trade and their heat zone mapping or whatever the hell they call it for selecting stocks are doing more harm than good.

"Walton, why do you always smell like my grandson's bedroom?"

There are two major ways to evaluate stocks: fundamental analysis and technical analysis.

Groan. Stop whining. This isn’t difficult.

Fundamental analysis means assessing a company’s financial statements: taking the accountants’ work and reaching conclusions with it.

Technical analysis is the financial equivalent of astrology. It involves looking at how a company’s stock is performing – not how the company itself is performing – and using that to figure out what the stock will do.

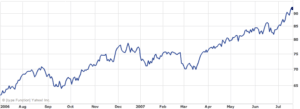
Here’s an example of why that’s insane. This is what ExxonMobil stock did from July 3, 2006 to July 20, 2007:

Exxon Chart 300x109 What Can John Wooden Teach us about Stock Analysis?

If you remember, public sentiment at the time ran something like:

The oil companies are bleeding us dry!
They’re fixing prices!
They’re in cahoots with the Bush Administration, the Elders of Zion, the Illuminati and the Trilateral Commission!

What could possibly be a better investment for the short term than a monopolistic, chronic polluter with powerful connections and a product we can’t live without? Any room for me on that gravy train?

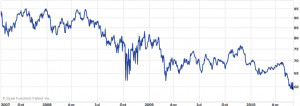
Here’s what ExxonMobil has done since then:
Exxon Chart 2 300x106 What Can John Wooden Teach us about Stock Analysis?
The scale on the y-axis changed, but not by much. What happened?

Centrifugal force happened. Public perception brought the stock up to a level it couldn’t sustain. Then reality set in and the stock got too expensive to attract new investors. In July of 2007, a technical analyst would have measured the angle of ExxonMobil’s rise and expected it to continue its northward progress. That same technical analyst wouldn’t reply to your emails today, assuming you could find him.

Most people who offer stock tips advocate some form of technical analysis. Why? Because it’s easy.  It takes .12 seconds to comprehend a chart.

You’ve heard the disclosure phrase “past performance is not necessarily indicative of future results.” Aside from the inelegant use of the passive voice, the statement makes a lot of sense. When a stock picker uses it to keep things all nice and legal, you have to make a couple of logical connections to deduce the message, which is:

That technical “analysis” we sell? This statement renders it invalid.

Everything is cyclical to some extent, right? No stock consistently outperforms the market, because the numbers don’t allow for it. There’s a ceiling, and it’s lower than you think. If the stock of a company with a market capitalization of $20 million were to double every year, within less than a generation it’d outpace the nation’s gross domestic product.

Fundamental analysis means perusing the unglamorous, dry columns of numbers that accompany corporations’ annual reports. It means going through a few years of data and comparing last year’s net revenue numbers to the previous year’s. Determining whether a company’s net profits increased, or if there’s a good reason why they decreased.

“Picking” a stock in the conventional sense – i.e., figuring out which one is going to suddenly jump in value – is a bigger scam than keno. The established stocks – the Dow components, the companies with the largest revenue and profit numbers – are traditionally the stocks with the strongest likelihood of maintaining their value.  But because they’re so big, it’s impossible for them to grow that much more. Any company on this list will probably halve in size before it doubles. For a sports analogy (ladies, I’ll make this as easy as possible), Gordon Beckham (.203) is far more likely to raise his batting average by 50 points than Ichiro Suzuki (.358) is. Market conditions prevent the frontrunners from gaining any significant value. It’s the laggards who make the biggest gains.

And suffer the biggest losses.

Continuing with the analogy, Ichiro’s batting average can afford to move 50 points in the other direction. But if Beckham’s does, he’ll be on either the bench or a bus to Charlotte in short order.

This is another place where we see how badly humanity assesses risk.  It’s easy to look at the potential for profit, less so to even acknowledge the possibility of loss. From Gilbert & Sullivan’s Utopia, Limited, the librettist suggests that if you’re going to create a company, begin with a trivial market capitalization. Say, 18p:

You can’t embark on trading too tremendous.
It’s strictly fair, and based on common sense.
If you succeed, your profits are stupendous,
And if you fail, pop goes your 18 pence.

A sports analogy, followed by a theater analogy. There, now everything’s in balance.

What’s more likely to hit zero – a company that’s already made its way to consistency, or one that’s closer to being 18 pence away from “popping”?

Of course there’s value in the occasional startup company. If you can find them with any consistency, then please, write this blog for us. You can even rename it after yourself.

And remember: the next coach who tells his team “you need to work on your technicals” will be the first.

Sex, nudity, pizza and free beer

So September 20’s post was a fun, no-pressure introduction to the three major types of financial statements and how they work. The results?

a) No one commented, and
b) No one pointed out that we promised to follow up on the details in the next post and didn’t.

Conclusion: reading financial statements is boring. Explaining how to read financial statements is boring. Even poking fun at how boring it is to read financial statements is apparently boring.

What do you want from us? No one said deciphering financial statements was interesting, except Warren Buffett, and do you want to take lifestyle advice from a polygamist who still lives in a house assessed at $700,000 despite having $36 billion to his name?

Let’s do this as pithily as possible and see where it leads:

If you’re looking to invest in a particular company, you can’t just go by word of mouth or general feeling. Worse yet, you don’t want to concern yourself with how pretty a graph the company’s stock price has been plotting recently (this is called technical analysis, and it’s the financial equivalent of phrenology.) Stupidest of all is the investment strategy that equates being a customer with being a shareholder.

You need to research, at least a little. Are you willing to spend a couple of hours to potentially earn yourself hundreds or thousands (or just as importantly, not cost yourself that much)? You should be, assuming you enjoy money and how easy it can make your life.

There are only 3 types of financial statements you need to know about. Any other ones you come across aren’t that important, at least not at this stage of the game. You find them at sec.gov/edgar/searchedgar/companysearch.html.

Enter the company name, scroll down to the first appearance of “10-K” in the left column, click on “Interactive Data”. Among other things, you’ll find the critical financial statements:

Income statements. Balance sheets. Cash flow statements. That’s it. Describing what’s in each one in sufficient detail could give us a year’s worth of blog posts, but let’s do this in digestible chunks.

What an income statement tells you, you can hopefully deduce from its title. Income is the difference between the revenue the company generated and the expenses it incurred, over a fixed period (usually a year, occasionally a quarter.)

Income statement (actual size)

Peruse the categories if you want, but the most important number at this point is the difference between gross income and expenses: net income, or in common parlance, profit.

But you can’t just rank companies by net income and say whichever one makes the most money is thus the best investment. You have to look at the relative sizes of the companies. Everything else being equal, a company that makes $100 million on revenues of $500 million is more impressive than one that makes $110 million on revenues of $1 billion.

A balance sheet tells you how much in assets the company has on hand, and how much it has in outstanding liabilities. The difference between them is called shareholders’ equity, which is one traditionally accepted measure of the company’s value.

Columns of numbers!

Over how long a period? A year?

You don’t listen, do you?
It’s the amount of assets and liabilities the company has (present tense), not the amount it acquired (past tense). That means it counts every dollar the company has ever taken in and hasn’t yet spent, minus every obligation it’s ever had and hasn’t yet settled. So in theory, a company could have a different balance sheet every millisecond. While an income statement refers to a particular period, a balance sheet refers to One Moment In Time, just like your prom did. Only without the awkward makeout sessions and vomiting.

Since shareholders’ equity, the value of the company, is assets minus liabilities by definition, you can understand why we keep hammering you to buy assets and sell liabilities. Divide net earnings (from the income statement) into shareholders’ equity and you get return on shareholders’ equity, a number that gives you an idea of how long it takes an investment in the company to pay for itself.

Finally, a cash flow statement tells you if the company’s bringing in more than it’s spending, and how much. That sounds straightforward, but it can occasionally be complicated (a rare repudiation of the oracular pronouncements in our book, Control Your Cash: Making Money Make Sense. Here’s the only other one.) There are 3 ways a company can generate revenue: via operations, investments, and financing.

Sorry, ran out of jokes. Alright, maybe this stuff is a little tedious

Operations is hopefully pretty clear. For Caterpillar, it’s making and selling lift trucks. For Anheuser-Busch, it’s brewing and selling beer. For General Motors, it’s collecting undeserved money from you and tens of millions of other taxpayers.

Unless the company in question is a financial firm, Investments is probably going to be a negative number, because it includes buying expensive things that help keep the company growing – factories and stuff. The category also includes buying and selling securities that have little or nothing to do with the company’s core business. For instance, if they have cash on hand, putting it in securities (Treasury bills, currency, other companies’ stocks or bonds) on behalf of the shareholders.

Financing includes issuing and buying back the company’s own stock and bonds. That means bringing new investors on board (usually healthy, if the company isn’t growing just for the sake of growing) and borrowing money (bad if it’s done for reasons other than covering new capital expenditures, paying it back with interest, and not risking default.)

Next time, or whenever we get around to it depending on the quality and quantity of this week’s comments, we’ll explain what desirable financial statements look like.

**This post is featured in the Carnival of Wealth #7-Entrepreneurship Edition**

**This post is featured in the Festival of Stocks**

A Fun Way To Spend A Saturday Afternoon


Poor little fella barely made it past the "Gross Revenue" line


If you’re already enough of a geek that you’re reading a personal finance blog despite being just a few keystrokes away from participating in The Golden Age Of Internet Porn, we invite you to take the next step.

Before you invest in any publicly traded stock, you need to understand how to read financial statements. This applies even if you let your company’s HR department handle your 401(k) and never bother to look at what mutual fund(s) it owns a piece of. You need to start looking. Stock prices move in both directions, in case you weren’t aware.

One more time: if you have a company-directed 401(k) then it probably owns part of a mutual fund, which is a basket of any number of stocks – usually around 80-100. Do you have time to measure the positive and negative indicators of 80 stocks? Probably not. That’s what fund managers and investment analysts are for.

If you rely on them, you’re not taking ownership of your finances. You’re passing the buck, almost literally. How many 401(k)s counted General Motors as a component a couple of years ago? You know, the most disastrously managed company in the history of American commerce*? When GM stock sank and ultimately got delisted – to say nothing of Fannie Mae, Freddie Mac, and other government wards that our elected officials insist on keeping on life support – how many of the people who indirectly held it via their mutual funds cared or noticed?

Would you like to know how to do this? If we taught you how to fish, would you ever worry again about going hungry? If we taught you how to weigh yourself, would that information come in handy for your next doctor’s appointment or Army special ops recruiting signup?

Understanding financial statements is more intricate than stepping on a scale, but not by much.

We needed a guinea pig, so we went down the list of America’s most profitable companies, stopping when we found one whose public image is pristine enough that people don’t routinely bitch about the company. That eliminated ExxonMobil, Microsoft, Wal-Mart, Pfizer, Merck, Philip Morris etc. We ended up at company #22, Corning. Besides, the Cincinnati-based glass and ceramics maker is only America’s 414th largest company by revenue, meaning it must have healthy profit margins.

We then give Corning the EDGAR treatment. EDGAR is the Securities and Exchange Commission’s Electronic Data-Gathering, Analysis, and Retrieval system: it’s where publicly traded companies are required by law to post their financials, and it’s at sec.gov/edgar.shtml.

You bored yet? Probably. Fix yourself a sandwich, turn on some music, meet us back here in 5. Here’s a Magic Eye picture to keep you occupied:

The money page on EDGAR is this one. Enter the relevant name or ticker symbol. Corning’s is GLW, which the company’s website says stands for “Corning Glass Works”. Apparently Jacques Demers is their vice president of investor relations.

It’ll ask for a “Filing Type”. The one you want is called the 10-K, which is essentially a company’s annual report without all the PR bullcrap.

It’s an htm file, should be easy to access. But don’t read it, it’s as interesting as watching glaciers move. Just search for the following phrases:
Consolidated Statements of Income
(plural)
Consolidated Balance Sheets
Consolidated Statements of Cash Flows


There are other financial statements, but these are easily the most important. We’ll bang them out one at a time, starting with the income statement (a/k/a the “profit and loss statement”).

Look at a company’s financial statements, and you can learn more than you imagined. You’ll discover how much debt the company is carrying, and if it’s leveraging itself to the point where it’ll be tough to pay back all the people it’s borrowing from. You’ll be able to determine whether the company is consistently increasing profits year after year, or if it’s standing on a plateau. Or a cliff. You’ll distinguish legitimate assets that can help the company grow from overvalued ones that make little difference to the bottom line.

Sifting through this is a little dreary at first, but so what? You’re an adult: most of what you’re now doing is boring. Kids get to enjoy life: they don’t have to concern themselves with saving receipts and filing taxes and learning to keep the warranty cards for their household appliances. The trade-off is that kids are stupid and poor.

Perusing a 10-K is as convoluted as you want it to be. We promise to make it painless, or at least reasonably so.

Next up, the three major types of financial statements and how they work.

*GM easily gets the nod over Enron, which never created anything tangible and was never a significant cog in the economy to begin with. GM used to make tanks to flatten Nazis with. Now its primary output is Christmas baskets for union bosses.

**Featured in the Carnival of Personal Finance**