How risky are your investments?
Adjectives won’t do, we need to quantify this. Go find your mutual fund. That is, go find which investment firm operates it and what the name of the fund is.
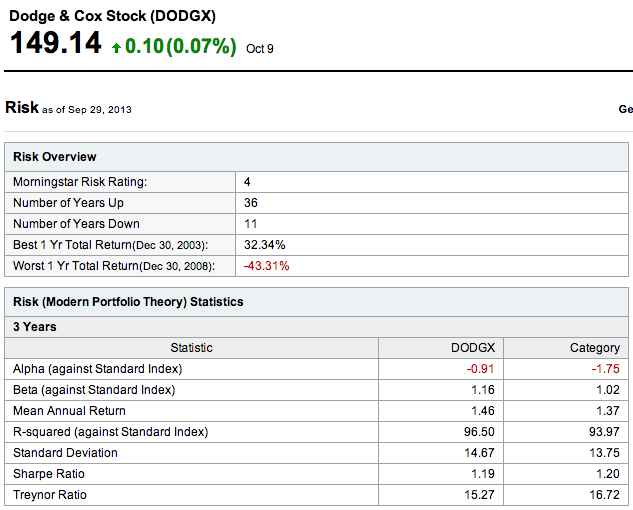
Can’t be bothered to do what we tell you, and would prefer to just follow along? Fine. Here’s one of the biggest mutual funds in existence, the Dodge & Cox Stock fund. Dodge & Cox is a firm based in San Francisco. “Stock” in this instance just means what this one particular mutual fund invests in, as distinguished from its brethren such as Dodge & Cox’s “Balanced” fund (which also includes fixed-income securities) or its “Income” fund (mostly highly rated bonds.) Dodge & Cox Stock is doing nicely over the last year, up 25%, but that’s not the point. Is the fund precarious, or is it secure? Here are the measures of DODGX’s risk. Most of the 1st chart is straightforward, but all of the entries in the 2nd chart should leave the tyronic reader clueless:
The hell? Let’s figure out what whomever wrote this is talking about, and if it’s of any value to us.
First of all, and this makes no sense on the surface of it, β (or if you’re an ugly Roman alphabet user, “Beta”) is more fundamental than α and should get our attention before α does.
β measures the difference between a fund’s return and that of a benchmark, so now we need to explain what a benchmark is. For most funds, the benchmark is the market as a whole, represented by the S&P 500. The theory goes that a fund manager isn’t justifying much of a paycheck if he can’t beat an index consisting of the stocks of the 500 largest publicly traded companies. Which is true.
But β doesn’t measure performance, it measures volatility. A security that rises 2% when the benchmark rises 1%, and falls 20% when the benchmark falls 10%, has a β of 2. It’s twice as volatile as the benchmark.
If you believe in a permanent bull market, a β of 2 is a good thing. You’ll enjoy twice the gains the market does, but also twice the losses, but that’s a net benefit if everything appreciates in the long run.
β of 0 means that the security has no relationship to the market at all. Something with a fixed yield, like an annuity that pays 2% per year no matter what, would have a β of 0. Cash and T-bills are 0, too. Most securities with a β of 0 don’t even trade publicly.
β can be negative, too. β of, say, -.11 means that if the market rises 18%, the security falls 2%. And vice versa. Such a security is probably going to be small, like an upstart gold mining stock, given that a sufficiently large stock will make up a good portion of the benchmark and thus by definition have to move somewhat in step with it. If the S&P 500 rises 20%, Apple stock isn’t going to fall 40% or anything close, since the latter comprises a decent part of the former.
The SPDR S&P 500 exchange-traded fund, which consists exactly of the stocks that comprise the S&P 500, has a β of 1. It has to. See, here’s the proof:
As for α, like β it’s usually used with regard to derivatives (e.g. mutual funds, ETFs) rather than to pure, underlying components of derivatives (e.g. GlaxoSmithKline stock, Toyota stock.) α measures the active return on an investment, as distinguished from the passive return. Active return is the work of the fund manager, passive return the work of the market just doing its thing. If a fund includes Microsoft stock that gains 10%, that’s part of the passive return. If the fund manager sells United Technologies stock to buy Caterpillar stock, and the Caterpillar stock gains 10%, that’s active return.
α compares the security’s performance again to a benchmark. In this case, it’s again the S&P 500. You take the price of the security at the end of the period (in the above case, that’s 3 years), plus whatever dividends accrued in that period, and divide it into the price you paid. You bought Boeing 3 years ago at $70, and now it’s $119? Ignoring dividends, that’s a 70% gain. In that same period, the S&P gained 43%. Relative to the benchmark, Boeing gained 63% (which is 70%/43%), which sounds pretty good.
But we’re not done yet. Remember how we said β is more fundamental than α? You need to figure out how well Boeing performed, relative to the benchmark, but also relative to the volatility. Boeing has a β of 1.12. So the expected excess return for Boeing is 1.12 x the increase in the benchmark. (And were the benchmark to have fallen over those 3 years, Boeing’s expected excess return would have been 1.12 x the fall.) Boeing’s rise is still impressive, but less so when compared to [a combination of its own volatility and the benchmark’s performance.]
Stay with us, this gets better and will eventually reach a thrilling conclusion. At the very least, we’ve explained what a couple of those mystifying quantities in the charts represent. This is already too much arcana for one post, however. More Wednesday, if you can hold out for that long.


